BasePerturbation#
- class hidimstat.base_perturbation.BasePerturbation(estimator, method: str = 'predict', loss: callable = <function mean_squared_error>, n_permutations: int = 50, statistical_test='ttest', features_groups=None, n_jobs: int = 1, random_state=None)[source]#
Bases:
BaseVariableImportance,GroupVariableImportanceMixinAbstract base class for model-agnostic variable importance measures using perturbation techniques.
- Parameters:
- estimatorsklearn-compatible estimator
The fitted estimator used for predictions.
- methodstr, default=”predict”
The method used for making predictions. This determines the predictions passed to the loss function. Supported methods are “predict”, “predict_proba”, “decision_function”, “transform”.
- losscallable, default=mean_squared_error
The function to compute the loss when comparing the perturbed model to the original model.
- n_permutationsint, default=50
Number of permutations for each feature group.
- statistical_testcallable or str, default=”nb-ttest”
Statistical test function for computing p-values from importance scores.
- features_groupsdict or None, default=None
Mapping of group names to lists of feature indices or names. If None, groups are inferred.
- n_jobsint, default=1
Number of parallel jobs for computation.
- random_stateint or None, default=None
Seed for reproducible permutations.
- Attributes:
- features_groupsdict
Mapping of feature groups identified during fit.
- importances_ndarray (n_groups,)
Importance scores for each feature group.
- loss_reference_float
Loss on original (non-perturbed) data.
- loss_dict
Loss values for each permutation of each group.
- pvalues_ndarray of shape (n_groups,)
P-values for importance scores.
Notes
This class is abstract. Subclasses must implement the _permutation method to define how feature groups are perturbed.
- __init__(estimator, method: str = 'predict', loss: callable = <function mean_squared_error>, n_permutations: int = 50, statistical_test='ttest', features_groups=None, n_jobs: int = 1, random_state=None)[source]#
- fit(X, y=None)[source]#
Initialize feature groups based on input data.
- Parameters:
- Xarray-like of shape (n_samples, n_features)
The training input samples.
- yarray-like, optional
The target values. Not used, present for API consistency. Defaults to None.
- Returns:
- selfobject
Returns the instance itself to enable method chaining.
See also
hidimstat.base_variable_importance.GroupVariableImportanceMixin.fitParent class fit method that performs the actual initialization.
- importance(X, y)[source]#
Compute the importance scores for each group of covariates.
- Parameters:
- Xarray-like of shape (n_samples, n_features)
The input samples to compute importance scores for.
- yarray-like of shape (n_samples,)
- importances_ndarray of shape (n_groups,)
The importance scores for each group of covariates. A higher score indicates greater importance of that group.
- Attributes:
- loss_reference_float
The loss of the model with the original (non-perturbed) data.
- loss_dict
Dictionary with indices as keys and arrays of perturbed losses as values. Contains the loss values for each permutation of each group.
- importances_ndarray of shape (n_groups,)
The calculated importance scores for each group.
- pvalues_ndarray of shape (n_groups,)
P-values from one-sample t-test testing if importance scores are significantly greater than 0.
- Returns:
- importances_ndarray of shape (n_features,)
Importance scores for each feature.
Notes
The importance score for each group is calculated as the mean increase in loss when that group is perturbed, compared to the reference loss. A higher importance score indicates that perturbing that group leads to worse model performance, suggesting those features are more important.
- fit_importance(X, y)[source]#
Fits the model to the data and computes feature importance scores. Convenience method that combines fit() and importance() into a single call.
- Parameters:
- Xarray-like of shape (n_samples, n_features)
Training data.
- yarray-like of shape (n_samples,)
Target values.
- Returns:
- importances_ndarray of shape (n_groups,)
The calculated importance scores for each feature group. Higher values indicate greater importance.
Notes
This method first calls fit() to identify feature groups, then calls importance() to compute the importance scores for each group.
- fdr_selection(fdr, fdr_control='bhq', reshaping_function=None, two_tailed_test=False)[source]#
Performs feature selection based on False Discovery Rate (FDR) control.
- Parameters:
- fdrfloat
The target false discovery rate level (between 0 and 1)
- fdr_control: {‘bhq’, ‘bhy’}, default=’bhq’
The FDR control method to use: - ‘bhq’: Benjamini-Hochberg procedure - ‘bhy’: Benjamini-Hochberg-Yekutieli procedure
- reshaping_function: callable or None, default=None
Optional reshaping function for FDR control methods. If None, defaults to sum of reciprocals for ‘bhy’.
- two_tailed_test: bool, default=False
If True, performs two-tailed test selection using both p-values for positive effects and one-minus p-values for negative effects. The sign of the effect is determined from the sign of the importance scores.
- Returns:
- selectedndarray of int
Integer array indicating the selected features. 1 indicates selected features with positive effects, -1 indicates selected features with negative effects, 0 indicates non-selected features.
- Raises:
- ValueError
If importances_ haven’t been computed yet
- AssertionError
If pvalues_ are missing or fdr_control is invalid
- fwer_selection(fwer, procedure='bonferroni', n_tests=None, two_tailed_test=False)[source]#
Performs feature selection based on Family-Wise Error Rate (FWER) control.
- Parameters:
- fwerfloat
The target family-wise error rate level (between 0 and 1)
- procedure{‘bonferroni’}, default=’bonferroni’
The FWER control method to use: - ‘bonferroni’: Bonferroni correction
- n_testsint or None, default=None
Factor for multiple testing correction. If None, uses the number of clusters or the number of features in this order.
- two_tailed_testbool, default=False
If True, uses the sign of the importance scores to indicate whether the selected features have positive or negative effects.
- Returns:
- selectedndarray of int
Integer array indicating the selected features. 1 indicates selected features with positive effects, -1 indicates selected features with negative effects, 0 indicates non-selected features.
- get_metadata_routing()[source]#
Get metadata routing of this object.
Please check User Guide on how the routing mechanism works.
- Returns:
- routingMetadataRequest
A
MetadataRequestencapsulating routing information.
- get_params(deep=True)[source]#
Get parameters for this estimator.
- Parameters:
- deepbool, default=True
If True, will return the parameters for this estimator and contained subobjects that are estimators.
- Returns:
- paramsdict
Parameter names mapped to their values.
- importance_selection(k_best=None, percentile=None, threshold_max=None, threshold_min=None)[source]#
Selects features based on variable importance.
- Parameters:
- k_bestint, default=None
Selects the top k features based on importance scores.
- percentilefloat, default=None
Selects features based on a specified percentile of importance scores.
- threshold_maxfloat, default=None
Selects features with importance scores below the specified maximum threshold.
- threshold_minfloat, default=None
Selects features with importance scores above the specified minimum threshold.
- Returns:
- selectionarray-like of shape (n_features,)
Binary array indicating the selected features.
- plot_importance(ax=None, ascending=False, feature_names=None, **seaborn_barplot_kwargs)[source]#
Plot feature importances as a horizontal bar plot.
- Parameters:
- axmatplotlib.axes.Axes or None, (default=None)
Axes object to draw the plot onto, otherwise uses the current Axes.
- ascending: bool, default=False
Whether to sort features by ascending importance.
- **seaborn_barplot_kwargsadditional keyword arguments
Additional arguments passed to seaborn.barplot. https://seaborn.pydata.org/generated/seaborn.barplot.html
- Returns:
- axmatplotlib.axes.Axes
The Axes object with the plot.
- pvalue_selection(k_lowest=None, percentile=None, threshold_max=0.05, threshold_min=None, alternative_hypothesis=False)[source]#
Selects features based on p-values.
- Parameters:
- k_lowestint, default=None
Selects the k features with lowest p-values.
- percentilefloat, default=None
Selects features based on a specified percentile of p-values.
- threshold_maxfloat, default=0.05
Selects features with p-values below the specified maximum threshold (0 to 1).
- threshold_minfloat, default=None
Selects features with p-values above the specified minimum threshold (0 to 1).
- alternative_hypothesisbool, default=False
If True, selects based on 1-pvalues instead of p-values.
- Returns:
- selectionarray-like of shape (n_features,)
Binary array indicating the selected features (True for selected).
- set_params(**params)[source]#
Set the parameters of this estimator.
The method works on simple estimators as well as on nested objects (such as
Pipeline). The latter have parameters of the form<component>__<parameter>so that it’s possible to update each component of a nested object.- Parameters:
- **paramsdict
Estimator parameters.
- Returns:
- selfestimator instance
Estimator instance.
Examples using hidimstat.base_perturbation.BasePerturbation#
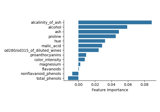
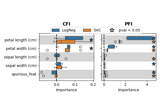
Conditional Feature Importance (CFI) on the wine dataset
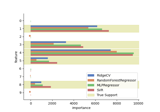
Leave-One-Covariate-Out (LOCO) feature importance with different regression models
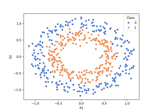
Conditional vs Marginal Importance on the XOR dataset
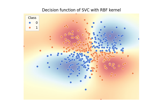
Measuring Individual and Group Variable Importance for Classification
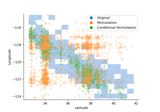
Pitfalls of Permutation Feature Importance (PFI) on the California Housing Dataset