PDP#
- class hidimstat.visualization.PDP(estimator, feature_names=None)[source]#
Bases:
objectPartial Dependence Plot (PDP) visualization. This class is based on sklearn.inspection.partial_dependence to compute the partial dependence values and provides methods to plot 1D and 2D PDPs. For each realization of a feature or pair of features \(x_S\), the partial dependence \(f_S(x_S)\) is defined as \(f_S(x_S) = \mathbb{E}_{X_{-S}}[ f(x_S, X_{-S})]\), where \(X_{-S}\) denotes all features except those in \(S\).
- Parameters:
- estimatorobject
A fitted scikit-learn estimator implementing predict or predict_proba.
- feature_nameslist of str, optional
Names of the features. If None, X0, X1, … will be used.
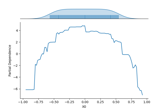
- plot(X, features, cmap='viridis', **kwargs)[source]#
Plot the Partial Dependence Plot for the specified feature (1D) or pair of features (2D). The marginal distribution of the feature(s) is also displayed.
- Parameters:
- Xarray-like of shape (n_samples, n_features)
The input data used to compute the partial dependence.
- featuresint or list of int
The feature index (for 1D PDP) or list of two feature indices (for 2D PDP).
- cmapstr, optional
The colormap to use for the plot (only for 2D PDP). Default is “viridis”.
- **kwargsadditional keyword arguments
Additional keyword arguments passed to: - sns.lineplot for 1D PDP - ax.contour for 2D PDP