Note
Go to the end to download the full example code.
Conditional Feature Importance (CFI) on the wine dataset#
This example demonstrates how to measure feature importance using CFI [Chamma et al.[1]] on the wine dataset. The data are the results of chemical analyses of wines grown in the same region in Italy, derived from three different cultivars. Thirteen features are used to predict three types of wine, making this a 3-class classification problem. In this example, we show how to use CFI to identify which variables are most important for solving the classification task with a neural network classifier.
Loading and preparing the data#
We start by loading the dataset and splitting it into training and test sets. This split will be used both for training the classifier and for the CFI method. The CFI method measures the importance of a feature by generating perturbations through sampling from the conditional distribution \(p(X^j | X^{-j})\), which is estimated on the training set.
Fitting the model and computing CFI feature importance#
To solve the classification task, we use a pipeline that first standardizes the features with StandardScaler, followed by a neural network (MLPClassifier) with one hidden layer of 100 neurons. Before measuring feature importance, we evaluate the estimator’s performance by reporting its accuracy score.
from sklearn.neural_network import MLPClassifier
from sklearn.pipeline import make_pipeline
from sklearn.preprocessing import StandardScaler

clf = make_pipeline(
    StandardScaler(),
    MLPClassifier(
        hidden_layer_sizes=(100),
        random_state=0,
        max_iter=500,
    ),
)

clf.fit(X_train, y_train)
y_pred = clf.predict(X_test)
print(f"Accuracy: {clf.score(X_test, y_test):.3f}")
Accuracy: 0.989
Next, we use the CFI class to measure feature importance. Here, we use a RidgeCV model to estimate the conditional expectation \(\mathbb{E}[X^j | X^{-j}]\). Since this is a classification task, we use log_loss and specify the “predict_proba” method of our estimator.
from sklearn.linear_model import RidgeCV
from sklearn.metrics import log_loss

from hidimstat import CFI

cfi = CFI(
    estimator=clf,
    loss=log_loss,
    method="predict_proba",
    imputation_model_continuous=RidgeCV(),
    random_state=0,
)
cfi.fit(
    X_train,
    y_train,
    groups={feat_name: [i] for i, feat_name in enumerate(load_wine().feature_names)},
)
importances = cfi.importance(X_test, y_test)
Visualization of CFI feature importance#
Finally, we visualize the importance of each feature using a bar plot.
import matplotlib.pyplot as plt

_, ax = plt.subplots(figsize=(6, 3))
ax = cfi.plot_importance(ax=ax)
ax.set_xlabel("Feature Importance")
plt.tight_layout()
plt.show()
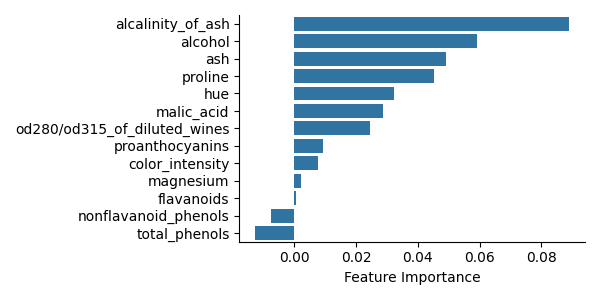
Variable importance analysis is meant to help scientific understanding, in particular to identify which features are important to differentiate Barolo, Grignolino, and Barbera wine types. Note: Despite very large marginal importance, the features ‘flavanoids’ and ‘ total_phenols’ are not picked by CFI, probably due to their high correlation (0.86 between these two) and their redundancy with other features.
References#
Total running time of the script: (0 minutes 9.039 seconds)