hidimstat.CFI#
- class hidimstat.CFI(estimator, loss: callable = <function root_mean_squared_error>, method: str = 'predict', n_jobs: int = 1, n_permutations: int = 50, imputation_model_continuous=None, imputation_model_categorical=None, random_state: int = None, categorical_max_cardinality: int = 10)[source]#
Bases:
BasePerturbation- __init__(estimator, loss: callable = <function root_mean_squared_error>, method: str = 'predict', n_jobs: int = 1, n_permutations: int = 50, imputation_model_continuous=None, imputation_model_categorical=None, random_state: int = None, categorical_max_cardinality: int = 10)[source]#
Conditional Feature Importance (CFI) algorithm. Chamma et al.[1] and for group-level see Chamma et al.[2].
- Parameters:
- estimatorsklearn compatible estimator, optional
The estimator to use for the prediction.
- losscallable, default=root_mean_squared_error
The loss function to use when comparing the perturbed model to the full model.
- methodstr, default=”predict”
The method to use for the prediction. This determines the predictions passed to the loss function. Supported methods are “predict”, “predict_proba” or “decision_function”.
- n_jobsint, default=1
The number of jobs to run in parallel. Parallelization is done over the variables or groups of variables.
- n_permutationsint, default=50
The number of permutations to perform. For each variable/group of variables, the mean of the losses over the n_permutations is computed.
- imputation_model_continuoussklearn compatible estimator, optional
The model used to estimate the conditional distribution of a given continuous variable/group of variables given the others.
- imputation_model_categoricalsklearn compatible estimator, optional
The model used to estimate the conditional distribution of a given categorical variable/group of variables given the others. Binary is considered as a special case of categorical.
- random_stateint, default=None
The random state to use for sampling.
- categorical_max_cardinalityint, default=10
The maximum cardinality of a variable to be considered as categorical when the variable type is inferred (set to “auto” or not provided).
References
- fit(X, y=None, groups=None, var_type='auto')[source]#
Fit the imputation models.
- Parameters:
- X: array-like of shape (n_samples, n_features)
The input samples.
- y: array-like of shape (n_samples,)
Not used, only present for consistency with the sklearn API.
- groups: dict, optional
A dictionary where the keys are the group names and the values are the list of column names corresponding to each group. If None, the groups are identified based on the columns of X.
- var_type: str or list, default=”auto”
The variable type. Supported types include “auto”, “continuous”, and “categorical”. If “auto”, the type is inferred from the cardinality of the unique values passed to the fit method.
- Returns
- ——-
- selfobject
Returns the instance itself.
- get_metadata_routing()[source]#
Get metadata routing of this object.
Please check User Guide on how the routing mechanism works.
- Returns:
- routingMetadataRequest
A
MetadataRequestencapsulating routing information.
- get_params(deep=True)[source]#
Get parameters for this estimator.
- Parameters:
- deepbool, default=True
If True, will return the parameters for this estimator and contained subobjects that are estimators.
- Returns:
- paramsdict
Parameter names mapped to their values.
- importance(X, y)[source]#
Compute the importance scores for each group of covariates.
- Parameters:
- X: array-like of shape (n_samples, n_features)
The input samples.
- y: array-like of shape (n_samples,)
The target values.
- Returns:
- out_dict: dict
A dictionary containing the following keys: - ‘loss_reference’: the loss of the model with the original data. - ‘loss’: a dictionary containing the loss of the perturbed model for each group. - ‘importance’: the importance scores for each group.
- plot_importance(ax=None, ascending=False, **seaborn_barplot_kwargs)[source]#
Plot feature importances as a horizontal bar plot.
- Parameters:
- axmatplotlib.axes.Axes or None, (default=None)
Axes object to draw the plot onto, otherwise uses the current Axes.
- ascending: bool, default=False
Whether to sort features by ascending importance.
- **seaborn_barplot_kwargsadditional keyword arguments
Additional arguments passed to seaborn.barplot. https://seaborn.pydata.org/generated/seaborn.barplot.html
- Returns:
- axmatplotlib.axes.Axes
The Axes object with the plot.
- predict(X)[source]#
Compute the predictions after perturbation of the data for each group of variables.
- Parameters:
- X: array-like of shape (n_samples, n_features)
The input samples.
- Returns:
- out: array-like of shape (n_groups, n_permutations, n_samples)
The predictions after perturbation of the data for each group of variables.
- selection(k_best=None, percentile=None, threshold=None, threshold_pvalue=None)[source]#
Selects features based on variable importance. In case several arguments are different from None, the returned selection is the conjunction of all of them.
- Parameters:
- k_bestint, optional, default=None
Selects the top k features based on importance scores.
- percentilefloat, optional, default=None
Selects features based on a specified percentile of importance scores.
- thresholdfloat, optional, default=None
Selects features with importance scores above the specified threshold.
- threshold_pvaluefloat, optional, default=None
Selects features with p-values below the specified threshold.
- Returns:
- selectionarray-like of shape (n_features,)
Binary array indicating the selected features.
- set_fit_request(*, groups: bool | None | str = '$UNCHANGED$', var_type: bool | None | str = '$UNCHANGED$') CFI[source]#
Configure whether metadata should be requested to be passed to the
fitmethod.Note that this method is only relevant when this estimator is used as a sub-estimator within a meta-estimator and metadata routing is enabled with
enable_metadata_routing=True(seesklearn.set_config()). Please check the User Guide on how the routing mechanism works.The options for each parameter are:
True: metadata is requested, and passed tofitif provided. The request is ignored if metadata is not provided.False: metadata is not requested and the meta-estimator will not pass it tofit.None: metadata is not requested, and the meta-estimator will raise an error if the user provides it.str: metadata should be passed to the meta-estimator with this given alias instead of the original name.
The default (
sklearn.utils.metadata_routing.UNCHANGED) retains the existing request. This allows you to change the request for some parameters and not others.Added in version 1.3.
- Parameters:
- groupsstr, True, False, or None, default=sklearn.utils.metadata_routing.UNCHANGED
Metadata routing for
groupsparameter infit.- var_typestr, True, False, or None, default=sklearn.utils.metadata_routing.UNCHANGED
Metadata routing for
var_typeparameter infit.
- Returns:
- selfobject
The updated object.
- set_params(**params)[source]#
Set the parameters of this estimator.
The method works on simple estimators as well as on nested objects (such as
Pipeline). The latter have parameters of the form<component>__<parameter>so that it’s possible to update each component of a nested object.- Parameters:
- **paramsdict
Estimator parameters.
- Returns:
- selfestimator instance
Estimator instance.
Examples using hidimstat.CFI#
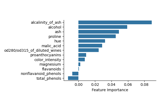
Conditional Feature Importance (CFI) on the wine dataset
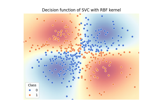
Conditional vs Marginal Importance on the XOR dataset
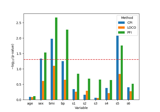
Measuring Individual and Group Variable Importance for Classification
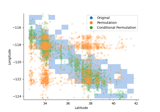
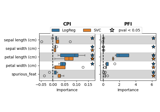
Pitfalls of Permutation Feature Importance (PFI) on the California Housing Dataset