Note
Go to the end to download the full example code.
Feature Importance on diabetes dataset using cross-validation#
In this example, we show how to compute variable importance using Permutation Feature Importance (PFI), Leave-One-Covariate-Out (LOCO), and Conditional Feature Importance (CFI) on the diabetes dataset. This example also showcases the use how to measure feature importance in a K-Fold cross-validation setting in order to use all the data available.
Load the diabetes dataset#
We start by loading the diabetes dataset from sklearn.
from sklearn.datasets import load_diabetes

diabetes = load_diabetes()
X, y = diabetes.data, diabetes.target

# Encode sex as binary
X[:, 1] = (X[:, 1] > 0.0).astype(int)
print(f"Number of samples: {X.shape[0]}, number of features: {X.shape[1]}")
Number of samples: 442, number of features: 10
Fit a baseline model on the diabetes dataset#
The benefit of perturbation-based variable importance methods, presented in this example, is that they are model-agnostic. Therefore, we can use any regression model. We here leverage this flexibility, using an ensemble model which consists of a Ridge regression model and a Histogram Gradient Boosting model, a Random Forest model, and a Lasso regression model combined with a Voting Regressor.
import numpy as np
from sklearn.base import clone
from sklearn.ensemble import (
    HistGradientBoostingRegressor,
    RandomForestRegressor,
    VotingRegressor,
)
from sklearn.linear_model import LassoCV, RidgeCV
from sklearn.metrics import r2_score
from sklearn.model_selection import KFold

n_folds = 5
cv = KFold(n_splits=n_folds, shuffle=True, random_state=0)
regressor = VotingRegressor(
    [
        ("ridge", RidgeCV()),
        ("hgb", HistGradientBoostingRegressor()),
        ("rf", RandomForestRegressor()),
        ("lasso", LassoCV()),
    ]
)

scores = []
regressor_list = [clone(regressor) for _ in range(n_folds)]
for i, (train_index, test_index) in enumerate(cv.split(X)):
    regressor_list[i].fit(X[train_index], y[train_index])
    scores.append(
        r2_score(y_true=y[test_index], y_pred=regressor_list[i].predict(X[test_index]))
    )
print(f"R2 scores across folds: {np.mean(scores):.3f} ± {np.std(scores):.3f}")
regressor
R2 scores across folds: 0.479 ± 0.096
Measure the importance of variables#
We now measure the importance of each variable using the three different methods: Conditional Feature Importance (CFI), Leave-One-Covariate-Out (LOCO), and Permutation Feature Importance (PFI). We use the K-Fold cross-validation scheme to leverage all the data available. This however comes with the challenge that the test statistics computed across folds are not independent since overlapping training sets are used to fit the model. To address this issue, we use the Nadeau-Bengio corrected t-test Nadeau and Bengio[1] which adjusts the variance estimation to account for the dependency between the test statistics. We use the n_jobs parameter to parallelize the computation across folds.
from hidimstat import CFICV

cfi_cv = CFICV(
    estimators=regressor_list,
    cv=cv,
    n_jobs=5,
    statistical_test="nb-ttest",
    random_state=0,
)
importances_cfi = cfi_cv.fit_importance(X, y)
Fitting importance estimators for each fold:   0%|          | 0/5 [00:00<?, ?it/s]
Fitting importance estimators for each fold: 100%|██████████| 5/5 [00:00<00:00, 253.47it/s]

Computing importance scores over folds:   0%|          | 0/5 [00:00<?, ?it/s]
Computing importance scores over folds: 100%|██████████| 5/5 [00:00<00:00, 3594.09it/s]
We repeat the same process using the LOCO method.
from hidimstat import LOCOCV

loco_cv = LOCOCV(
    estimators=regressor_list,
    cv=cv,
    n_jobs=5,
    statistical_test="nb-ttest",
)
importances_loco = loco_cv.fit_importance(X, y)
Fitting importance estimators for each fold:   0%|          | 0/5 [00:00<?, ?it/s]
Fitting importance estimators for each fold: 100%|██████████| 5/5 [00:00<00:00, 1542.25it/s]

Computing importance scores over folds:   0%|          | 0/5 [00:00<?, ?it/s]
Computing importance scores over folds: 100%|██████████| 5/5 [00:00<00:00, 2976.79it/s]
Finally, we repeat the same process using the PFI method.
from hidimstat import PFICV

pfi_cv = PFICV(
    estimators=regressor_list,
    cv=cv,
    n_jobs=5,
    statistical_test="nb-ttest",
    random_state=0,
)
importances_pfi = pfi_cv.fit_importance(X, y)
Fitting importance estimators for each fold:   0%|          | 0/5 [00:00<?, ?it/s]
Fitting importance estimators for each fold: 100%|██████████| 5/5 [00:00<00:00, 386.96it/s]

Computing importance scores over folds:   0%|          | 0/5 [00:00<?, ?it/s]
Computing importance scores over folds: 100%|██████████| 5/5 [00:00<00:00, 2397.29it/s]
Analyze the results#
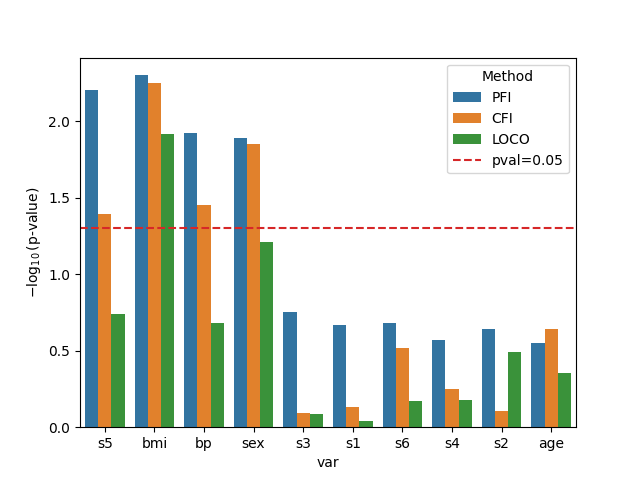
Finally, we visualize the results obtained with the three different methods. We plot the negative log10 p-values for each variable and each method. A horizontal red-dashed line indicates the significance threshold at p-value=0.05.
import matplotlib.pyplot as plt
import pandas as pd
import seaborn as sns

df_plot = pd.concat(
    [
        pd.DataFrame(
            {
                "var": diabetes.feature_names,
                "importance": vim.importances_.mean(axis=1),
                "pval": vim.pvalues_,
                "method": vim_name,
            }
        )
        for vim, vim_name in zip(
            [cfi_cv, loco_cv, pfi_cv],
            ["CFI", "LOCO", "PFI"],
        )
    ]
)
df_plot = df_plot.sort_values("importance", ascending=False)
df_plot["log10pval"] = -np.log10(df_plot["pval"])

_, ax = plt.subplots()
sns.barplot(
    data=df_plot,
    x="var",
    y="log10pval",
    hue="method",
    ax=ax,
)
ax.axhline(-np.log10(0.05), color="tab:red", ls="--", label="pval=0.05")
ax.set_ylabel(r"$-\log_{10}(\text{p-value})$")
ax.legend(title="Method")
<matplotlib.legend.Legend object at 0x7f61f90ffc50>
Several trends can be observed from the results: PFI tends to give smaller p-values (that is higher bars in the plot) than LOCO and CFI. This is expected since PFI is known to overestimate the importance of correlated variables. On the other hand, LOCO has in general, larger p-values (smaller bars in the plot). This is also a known trend since LOCO tends to suffer from lower statistical power.
References#
Total running time of the script: (0 minutes 36.147 seconds)
Estimated memory usage: 1091 MB