hidimstat.base_variable_importance.BaseVariableImportance#
- class hidimstat.base_variable_importance.BaseVariableImportance[source]#
Bases:
BaseEstimatorBase class for variable importance methods.
This class provides a foundation for implementing variable importance methods, including feature selection based on importance scores and p-values.
- Attributes:
- importances_array-like of shape (n_features,), default=None
The computed importance scores for each feature.
- pvalues_array-like of shape (n_features,), default=None
The computed p-values for each feature.
- selections_array-like of shape (n_features,), default=None
Binary mask indicating selected features.
Methods
selection(k_best=None, percentile=None, threshold=None, threshold_pvalue=None)
Selects features based on importance scores and/or p-values using various criteria.
_check_importance()
Checks if importance scores and p-values have been computed.
- selection(k_best=None, percentile=None, threshold=None, threshold_pvalue=None)[source]#
Selects features based on variable importance. In case several arguments are different from None, the returned selection is the conjunction of all of them.
- Parameters:
- k_bestint, optional, default=None
Selects the top k features based on importance scores.
- percentilefloat, optional, default=None
Selects features based on a specified percentile of importance scores.
- thresholdfloat, optional, default=None
Selects features with importance scores above the specified threshold.
- threshold_pvaluefloat, optional, default=None
Selects features with p-values below the specified threshold.
- Returns:
- selectionarray-like of shape (n_features,)
Binary array indicating the selected features.
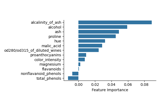
- plot_importance(ax=None, ascending=False, **seaborn_barplot_kwargs)[source]#
Plot feature importances as a horizontal bar plot.
- Parameters:
- axmatplotlib.axes.Axes or None, (default=None)
Axes object to draw the plot onto, otherwise uses the current Axes.
- ascending: bool, default=False
Whether to sort features by ascending importance.
- **seaborn_barplot_kwargsadditional keyword arguments
Additional arguments passed to seaborn.barplot. https://seaborn.pydata.org/generated/seaborn.barplot.html
- Returns:
- axmatplotlib.axes.Axes
The Axes object with the plot.
- get_metadata_routing()[source]#
Get metadata routing of this object.
Please check User Guide on how the routing mechanism works.
- Returns:
- routingMetadataRequest
A
MetadataRequestencapsulating routing information.
- get_params(deep=True)[source]#
Get parameters for this estimator.
- Parameters:
- deepbool, default=True
If True, will return the parameters for this estimator and contained subobjects that are estimators.
- Returns:
- paramsdict
Parameter names mapped to their values.
- set_params(**params)[source]#
Set the parameters of this estimator.
The method works on simple estimators as well as on nested objects (such as
Pipeline). The latter have parameters of the form<component>__<parameter>so that it’s possible to update each component of a nested object.- Parameters:
- **paramsdict
Estimator parameters.
- Returns:
- selfestimator instance
Estimator instance.
Examples using hidimstat.base_variable_importance.BaseVariableImportance#
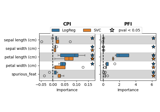
Conditional Feature Importance (CFI) on the wine dataset
Leave-One-Covariate-Out (LOCO) feature importance with different regression models
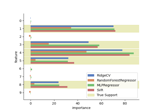
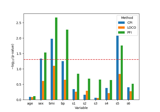
Distilled Conditional Randomization Test (dCRT) using Lasso vs Random Forest learners
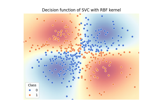
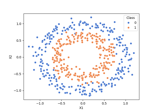
Conditional vs Marginal Importance on the XOR dataset
Measuring Individual and Group Variable Importance for Classification
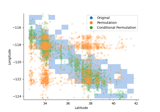
Pitfalls of Permutation Feature Importance (PFI) on the California Housing Dataset