Note
Go to the end to download the full example code.
Variable Importance on diabetes dataset#
Variable Importance estimates the influence of a given input variable to the prediction made by a model. To assess variable importance in a prediction problem, Breiman[1] introduced the permutation approach where the values are shuffled for one variable/column at a time. This permutation breaks the relationship between the variable of interest and the outcome. Following, the loss score is checked before and after this substitution for any significant drop in the performance which reflects the significance of this variable to predict the outcome. This ease-to-use solution is demonstrated, in the work by Strobl et al.[2], to be affected by the degree of correlation between the variables, thus biased towards truly non-significant variables highly correlated with the significant ones and creating fake significant variables. They introduced a solution for the Random Forest estimator based on conditional sampling by performing sub-groups permutation when bisecting the space using the conditioning variables of the buiding process. However, this solution is exclusive to the Random Forest and is costly with high-dimensional settings. Chamma et al.[3] introduced a new model-agnostic solution to bypass the limitations of the permutation approach under the use of the conditional schemes. The variable of interest does contain two types of information: 1) the relationship with the remaining variables and 2) the relationship with the outcome. The standard permutation, while breaking the relationship with the outcome, is also destroying the dependency with the remaining variables. Therefore, instead of directly permuting the variable of interest, the variable of interest is predicted by the remaining variables and the residuals of this prediction are permuted before reconstructing the new version of the variable. This solution preserves the dependency with the remaining variables.
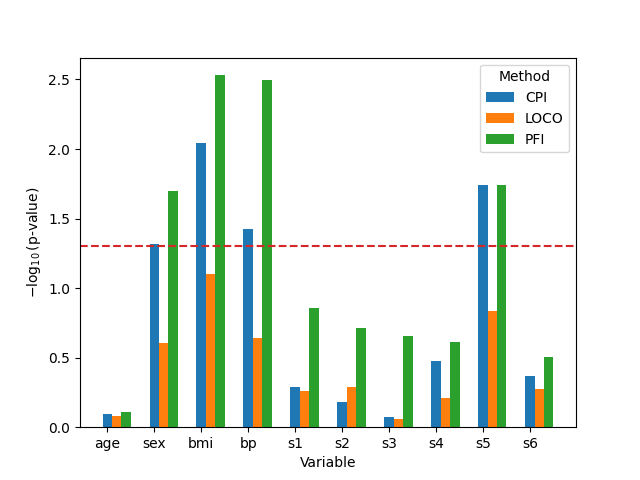
In this example, we compare both the standard permutation and its conditional variant approaches for variable importance on the diabetes dataset for the single-level case. The aim is to see if integrating the new statistically-controlled solution has an impact on the results.
References#
Imports needed for this script#
import matplotlib.pyplot as plt
import numpy as np
import pandas as pd
from scipy.stats import norm
from sklearn.base import clone
from sklearn.datasets import load_diabetes
from sklearn.linear_model import LogisticRegressionCV, RidgeCV
from sklearn.metrics import r2_score, root_mean_squared_error
from sklearn.model_selection import KFold

from hidimstat import CPI, LOCO, PFI
Load the diabetes dataset#
diabetes = load_diabetes()
X, y = diabetes.data, diabetes.target
# Encode sex as binary
X[:, 1] = (X[:, 1] > 0.0).astype(int)
Fit a baseline model on the diabetes dataset#
We use a Ridge regression model with a 10-fold cross-validation to fit the diabetes dataset.
n_folds = 5
regressor = RidgeCV(alphas=np.logspace(-3, 3, 10))
regressor_list = [clone(regressor) for _ in range(n_folds)]
kf = KFold(n_splits=n_folds, shuffle=True, random_state=0)
for i, (train_index, test_index) in enumerate(kf.split(X)):
    regressor_list[i].fit(X[train_index], y[train_index])
    score = r2_score(
        y_true=y[test_index], y_pred=regressor_list[i].predict(X[test_index])
    )
    mse = root_mean_squared_error(
        y_true=y[test_index], y_pred=regressor_list[i].predict(X[test_index])
    )

    print(f"Fold {i}: {score}")
    print(f"Fold {i}: {mse}")
Fold 0: 0.33083473382923934
Fold 0: 58.578414587141616
Fold 1: 0.4612105596220809
Fold 1: 53.69203761571651
Fold 2: 0.5325803774775466
Fold 2: 54.71097678129963
Fold 3: 0.5064809104496365
Fold 3: 54.272416623817435
Fold 4: 0.5979653259033298
Fold 4: 52.28738181690228
Fit a baselien model on the diabetes dataset#
We use a Ridge regression model with a 10-fold cross-validation to fit the diabetes dataset.
n_folds = 10
regressor = RidgeCV(alphas=np.logspace(-3, 3, 10))
regressor_list = [clone(regressor) for _ in range(n_folds)]
kf = KFold(n_splits=n_folds, shuffle=True, random_state=0)
for i, (train_index, test_index) in enumerate(kf.split(X)):
    regressor_list[i].fit(X[train_index], y[train_index])
    score = r2_score(
        y_true=y[test_index], y_pred=regressor_list[i].predict(X[test_index])
    )
    mse = root_mean_squared_error(
        y_true=y[test_index], y_pred=regressor_list[i].predict(X[test_index])
    )

    print(f"Fold {i}: {score}")
    print(f"Fold {i}: {mse}")
Fold 0: 0.34890711975299304
Fold 0: 56.144182594640924
Fold 1: 0.2721892039082311
Fold 1: 61.35394986028169
Fold 2: 0.536661654861091
Fold 2: 49.06762118785015
Fold 3: 0.3696138811104912
Fold 3: 59.01755532549113
Fold 4: 0.5855653971692454
Fold 4: 51.49494754537288
Fold 5: 0.46243581455728044
Fold 5: 58.31346323072169
Fold 6: 0.5237829173241707
Fold 6: 51.342031718189716
Fold 7: 0.4852439911493507
Fold 7: 56.84140735040956
Fold 8: 0.6653054560599455
Fold 8: 47.261853043748566
Fold 9: 0.5514651857120557
Fold 9: 55.72320747332666
Measure the importance of variables using the CPI method#
cpi_importance_list = []
for i, (train_index, test_index) in enumerate(kf.split(X)):
    print(f"Fold {i}")
    X_train, X_test = X[train_index], X[test_index]
    y_train, y_test = y[train_index], y[test_index]
    cpi = CPI(
        estimator=regressor_list[i],
        imputation_model_continuous=RidgeCV(alphas=np.logspace(-3, 3, 10)),
        imputation_model_categorical=LogisticRegressionCV(Cs=np.logspace(-2, 2, 10)),
        # covariate_estimator=HistGradientBoostingRegressor(random_state=0,),
        n_permutations=50,
        random_state=0,
        n_jobs=4,
    )
    cpi.fit(X_train, y_train)
    importance = cpi.importance(X_test, y_test)
    cpi_importance_list.append(importance)
Fold 0
Fold 1
Fold 2
Fold 3
Fold 4
Fold 5
Fold 6
Fold 7
Fold 8
Fold 9
Measure the importance of variables using the LOCO method#
loco_importance_list = []

for i, (train_index, test_index) in enumerate(kf.split(X)):
    print(f"Fold {i}")
    X_train, X_test = X[train_index], X[test_index]
    y_train, y_test = y[train_index], y[test_index]
    loco = LOCO(
        estimator=regressor_list[i],
        n_jobs=4,
    )
    loco.fit(X_train, y_train)
    importance = loco.importance(X_test, y_test)
    loco_importance_list.append(importance)
Fold 0
Fold 1
Fold 2
Fold 3
Fold 4
Fold 5
Fold 6
Fold 7
Fold 8
Fold 9
Measure the importance of variables using the permutation method#
pfi_importance_list = []

for i, (train_index, test_index) in enumerate(kf.split(X)):
    print(f"Fold {i}")
    X_train, X_test = X[train_index], X[test_index]
    y_train, y_test = y[train_index], y[test_index]
    pfi = PFI(
        estimator=regressor_list[i],
        n_permutations=50,
        random_state=0,
        n_jobs=4,
    )
    pfi.fit(X_train, y_train)
    importance = pfi.importance(X_test, y_test)
    pfi_importance_list.append(importance)
Fold 0
Fold 1
Fold 2
Fold 3
Fold 4
Fold 5
Fold 6
Fold 7
Fold 8
Fold 9
Define a function to compute the p-value from importance values#
Analyze the results#
cpi_vim_arr = np.array([x["importance"] for x in cpi_importance_list]) / 2
cpi_pval = compute_pval(cpi_vim_arr)

vim = [
    pd.DataFrame(
        {
            "var": np.arange(cpi_vim_arr.shape[1]),
            "importance": x["importance"],
            "fold": i,
            "pval": cpi_pval,
            "method": "CPI",
        }
    )
    for x in cpi_importance_list
]

loco_vim_arr = np.array([x["importance"] for x in loco_importance_list])
loco_pval = compute_pval(loco_vim_arr)

vim += [
    pd.DataFrame(
        {
            "var": np.arange(loco_vim_arr.shape[1]),
            "importance": x["importance"],
            "fold": i,
            "pval": loco_pval,
            "method": "LOCO",
        }
    )
    for x in loco_importance_list
]

pfi_vim_arr = np.array([x["importance"] for x in pfi_importance_list])
pfi_pval = compute_pval(pfi_vim_arr)

vim += [
    pd.DataFrame(
        {
            "var": np.arange(pfi_vim_arr.shape[1]),
            "importance": x["importance"],
            "fold": i,
            "pval": pfi_pval,
            "method": "PFI",
        }
    )
    for x in pfi_importance_list
]

fig, ax = plt.subplots()
df_plot = pd.concat(vim)
df_plot["pval"] = -np.log10(df_plot["pval"])
methods = df_plot["method"].unique()
colors = plt.get_cmap("tab10", 10)

for i, method in enumerate(methods):
    subset = df_plot[df_plot["method"] == method]
    ax.bar(
        subset["var"] + i * 0.2,
        subset["pval"],
        width=0.2,
        label=method,
        color=colors(i),
    )

ax.legend(title="Method")
ax.set_ylabel(r"$-\log_{10}(\text{p-value})$")
ax.axhline(-np.log10(0.05), color="tab:red", ls="--")
ax.set_xlabel("Variable")
ax.set_xticks(range(len(diabetes.feature_names)))
ax.set_xticklabels(diabetes.feature_names)
plt.show()
Total running time of the script: (0 minutes 13.803 seconds)