Note
Go to the end to download the full example code.
Measuring Individual and Group Variable Importance for Classification#
In this example, we show on the Iris dataset how to measure variable importance for classification tasks. We use two different variable importance methods: Conditional Permutation importance (CPI) and Permutation Feature Importance (PFI) with two different classifiers: Logistic Regression (LR) and Support Vector Classifier (SVC). We start by measuring the importance of individual variables and then show how to measure the importance of groups of variables.
To briefly summarize the two methods:
PFI (Permutation Feature Importance) shuffles the values of a feature and measures the increase in the loss when predicting (using om the same full model) on the shuffled data.
CPI (Conditional Permutation Importance) is a conditional version of PFI that preserves the conditional distribution of the feature. It introduces a second model to estimate this conditional distribution.
import matplotlib.pyplot as plt
import numpy as np
import pandas as pd
import seaborn as sns
from joblib import Parallel, delayed
from scipy.stats import ttest_1samp
from sklearn.base import clone
from sklearn.datasets import load_iris
from sklearn.linear_model import LogisticRegressionCV, RidgeCV
from sklearn.metrics import balanced_accuracy_score, hinge_loss, log_loss
from sklearn.model_selection import GridSearchCV, KFold
from sklearn.svm import SVC

from hidimstat import CPI, PFI
Load the iris dataset and add a spurious feature#
We load the iris dataset and add a spurious feature that is a linear combination of the petal length, width amd some noise but not related to the target. The spurious feature allows to illustrate that PFI is not robust to spurious features, contrarily to CPI.
dataset = load_iris()
rng = np.random.RandomState(0)
X, y = dataset.data, dataset.target
spurious_feat = X[:, 2] + X[:, 3]
spurious_feat += rng.normal(size=X.shape[0], scale=np.std(spurious_feat) / 2)
X = np.hstack([X, spurious_feat.reshape(-1, 1)])

dataset.feature_names = dataset.feature_names + ["spurious_feat"]
Measure variable importance#
Since both methods compute variable importance as a loss difference, they require a K-fold cross-fitting. Computing the importance for each fold is embarassingly parallel. For this reason, we encapsulate the main computations in a function and use joblib to parallelize the computation.
def run_one_fold(X, y, model, train_index, test_index, vim_name="CPI", groups=None):
    model_c = clone(model)
    model_c.fit(X[train_index], y[train_index])
    y_pred = model_c.predict(X[test_index])

    if isinstance(model_c, LogisticRegressionCV):
        method = "predict_proba"
        loss = log_loss
        model_name = "LogReg"
    else:
        method = "decision_function"
        loss = hinge_loss
        model_name = "SVC"

    if vim_name == "CPI":
        vim = CPI(
            estimator=model_c,
            imputation_model_continuous=RidgeCV(alphas=np.logspace(-3, 3, 10)),
            n_permutations=50,
            random_state=0,
            method=method,
            loss=loss,
        )
    elif vim_name == "PFI":
        vim = PFI(
            estimator=model_c,
            n_permutations=50,
            random_state=0,
            method=method,
            loss=loss,
        )

    vim.fit(X[train_index], y[train_index], groups=groups)
    importance = vim.importance(X[test_index], y[test_index])["importance"]

    return pd.DataFrame(
        {
            "feature": groups.keys(),
            "importance": importance,
            "vim": vim_name,
            "model": model_name,
            "score": balanced_accuracy_score(y_true=y[test_index], y_pred=y_pred),
        }
    )
We use two different classifiers: LR with cross-validation and SVC with a RBF kernel. We then compute the importance for each (importance method, classifier, fold) combination, in parallel.
models = [
    LogisticRegressionCV(Cs=np.logspace(-3, 3, 10), tol=1e-3, max_iter=1000),
    GridSearchCV(SVC(kernel="rbf"), {"C": np.logspace(-3, 3, 10)}),
]
cv = KFold(n_splits=5, shuffle=True, random_state=0)
groups = {ft: i for i, ft in enumerate(dataset.feature_names)}
out_list = Parallel(n_jobs=5)(
    delayed(run_one_fold)(
        X, y, model, train_index, test_index, vim_name=vim_name, groups=groups
    )
    for train_index, test_index in cv.split(X)
    for model in models
    for vim_name in ["CPI", "PFI"]
)
df = pd.concat(out_list)
Using the importance values, we can compute the p-value of each feature. As we will see, the p-values computed with PFI are not valid since the method does not provide type-1 error control.
def compute_pval(df, threshold=0.05):
    df_pval_list = []
    for model in df["model"].unique():
        for vim in df["vim"].unique():
            for feature in df["feature"].unique():
                pval = ttest_1samp(
                    df[
                        (df["model"] == model)
                        & (df["vim"] == vim)
                        & (df["feature"] == feature)
                    ]["importance"],
                    0,
                    alternative="greater",
                ).pvalue
                df_pval_list.append(
                    {
                        "feature": feature,
                        "vim": vim,
                        "model": model,
                        "pval": pval,
                        "y_coord": df[(df["vim"] == vim)]["importance"].max(),
                    }
                )
    df_pval = pd.DataFrame(df_pval_list)
    df_pval = df_pval.query(f"pval < {threshold}")
    return df_pval


threshold = 0.05
df_pval = compute_pval(df, threshold=threshold)
Visualization of the results#
def plot_results(df_importance, df_pval):
    fig, axes = plt.subplots(1, 2, figsize=(6, 3), sharey=True)
    for method, ax in zip(["CPI", "PFI"], axes):
        df_method = df_importance[df_importance["vim"] == method]
        legend = ax == axes[0]
        sns.stripplot(
            data=df_pval[df_pval["vim"] == method],
            x="y_coord",
            y="feature",
            hue="model",
            ax=ax,
            edgecolor="k",
            linewidth=1,
            marker="*",
            s=10,
            legend=False,
            dodge=0.5,
            orient="h",
        )
        sns.boxplot(
            data=df_method,
            x="importance",
            y="feature",
            hue="model",
            ax=ax,
            legend=legend,
            orient="h",
        )
        ax.set_title(method, fontweight="bold", y=1.12)
        ax.axvline(0, color="k", linestyle="--")
        ax.set_xlabel("Importance")
        ax.set_ylabel("")
        for i in range(len(df_method["feature"].unique())):
            if i % 2 == 0:
                ax.axhspan(i - 0.5, i + 0.5, color="gray", alpha=0.33)

    ax = axes[0]
    handles, labels = ax.get_legend_handles_labels()
    ax.legend().remove()
    handles.append(
        plt.Line2D(
            [0],
            [0],
            marker="*",
            color="w",
            markerfacecolor="w",
            markeredgecolor="k",
            markersize=12,
            label=f"pval < {threshold}",
            markeredgewidth=1.5,
        )
    )
    fig.legend(
        handles=handles,
        labels=labels + [f"pval < {threshold}"],
        loc="center",
        bbox_to_anchor=(0.6, 0.82),
        ncol=3,
    )
    plt.tight_layout()
    plt.show()


plot_results(df, df_pval)
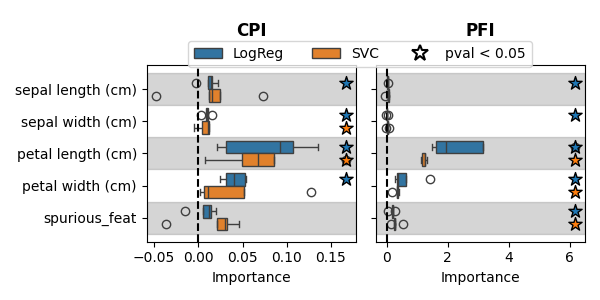
The boxplot shows the importance of each feature, with colors indicating the classifier used. A star marks the features that have a p-value (computed with a t-test) below 0.05. As expected, the spurious feature is not selected by CPI, but is selected by Permutation Importance. It can also be seen that using the logistic regression model leads to greater statistical power than using the SVC model. This can be explained by the small number of samples that do not allow leveraging the additional flexibility of the SVC model. The SVC model could benefit from a more extensive hyperparameter search, especially optimizing the gamma parameter of the RBF kernel, which would be feasible with more data.
Measuring the importance of groups of features#
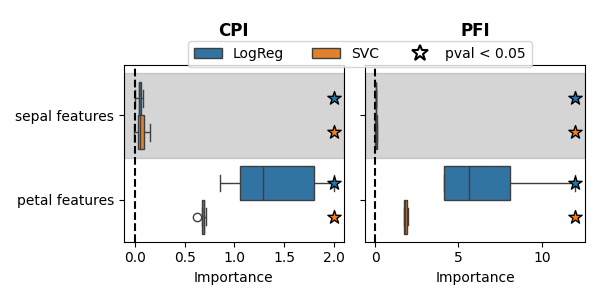
In the example above, CPI did not select some features. This is because it measures conditional importance, which is the additional independent information a feature provides knowing all the other features. When features are highly correlated, this additional information decreases, resulting in lower importance rankings. To mitigate this issue, we can group correlated features together and measure the importance of these feature groups. For instance, we can group ‘sepal width’ with ‘sepal length’ and ‘petal length’ with ‘petal width’ and the spurious feature.
groups = {"sepal features": [0, 1], "petal features": [2, 3, 4]}
out_list = Parallel(n_jobs=5)(
    delayed(run_one_fold)(
        X, y, model, train_index, test_index, vim_name=vim_name, groups=groups
    )
    for train_index, test_index in cv.split(X)
    for model in models
    for vim_name in ["CPI", "PFI"]
)

df_grouped = pd.concat(out_list)
df_pval = compute_pval(df_grouped, threshold=threshold)
plot_results(df_grouped, df_pval)
Total running time of the script: (0 minutes 36.569 seconds)